Property
gapAxisToLabel
| Type | Name | Default |
|---|---|---|
| int? | gapAxisToLabel | 5 |
Provides the distance between the domain label and the line domain

labelAnchor
| Type | Name | Default |
|---|---|---|
| LabelAnchor | labelAnchor | LabelAnchor.centered |
Label position based on thick
labelStyle
| Type | Name | Default |
|---|---|---|
| LabelStyle | labelStyle | LabelStyle() |
Gives style to the domain text label
lineStyle
| Type | Name | Default |
|---|---|---|
| LineStyle | lineStyle | LineStyle() |
Gives style to the line domain
showLine
| Type | Name | Default |
|---|---|---|
| bool | showLine | true |
Show domain line
tickLength
| Type | Name | Default |
|---|---|---|
| int | tickLength | 3 |
Length of thick

numericViewport
| Type | Name | Default |
|---|---|---|
| NumericViewport | numericViewport | null |
Limits the chart viewport
ordinalViewport
| Type | Name | Default |
|---|---|---|
| OrdinalViewport | ordinalViewport | null |
Limits the chart viewport
timeViewport
| Type | Name | Default |
|---|---|---|
| TimeViewport | timeViewport | null |
Limits the chart viewport
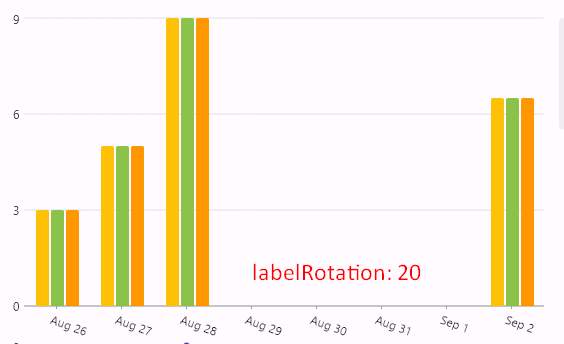
labelRotation
| Type | Name | Default |
|---|---|---|
| int | labelRotation | 0 |
starting point at center right.
center right = 0 degree.
starting 30 - 90, will be affect to height of chart widget.
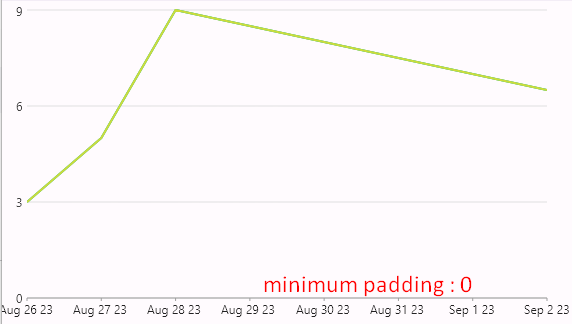
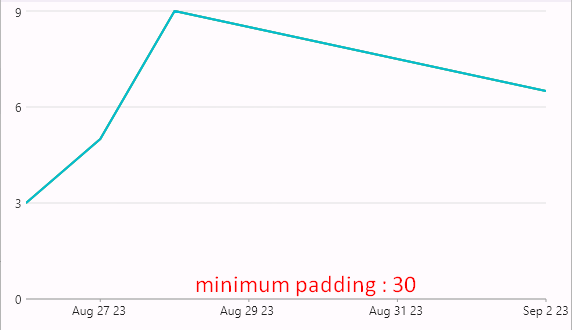
minimumPaddingBetweenLabels
| Type | Name | Default |
|---|---|---|
| int | minimumPaddingBetweenLabels | 0 |
can be use as space beetween label.
more smaller padding, then label will be getting closer, they can even collide with each other, take each other's place.
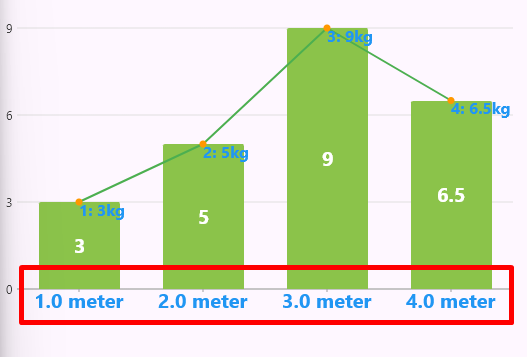
tickLabelFormatterN
| Type | Default |
|---|---|
| String Function(num? domain) | null |
label format for numeric chart series.
tickLabelFormatterN: (domain) {
  return '$domain meter';
},
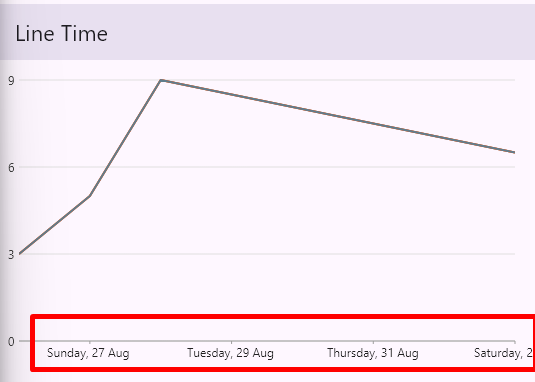
tickLabelFormatterT
| Type | Default |
|---|---|
| String Function(DateTime domain) | null |
label format for time series. Combine with intl to format date
tickLabelFormatterT: (domain) {
  return DateFormat('EEEE, d MMM').format(domain);
},
noRenderSpec
| Type | Name | Default |
|---|---|---|
| bool | noRenderSpec | false |
if set true, will disable label and tick axis

numericTickProvider
| Type | Default |
|---|---|
| NumericTickProvider | null |
manage tick on axis
useGridLine
| Type | Default |
|---|---|
| bool | false |
use grid line spec for each tick on domain, tick will be replace.
to use this type, set noRenderSpec to false

gridLineStyle
| Type | Default |
|---|---|
| LineStyle | default to LineStyle |
styling of lines perpendicular to the axis line.

tickLineStyle
| Type | Default |
|---|---|
| LineStyle | default to LineStyle |
styling of tick line on axis. active when noRenderSpec and useGridLine is false.
domainAxis: const DomainAxis(
  tickLength: 8,
  tickLineStyle:
      LineStyle(color: Colors.purple, thickness: 4),
),

Tips
- Use
labelRotationandminimumPaddingBetweenLabelsto show more label in time series widget