p2
import 'dart:math' as math;
import 'package:d_chart/d_chart.dart';
import 'package:flutter/material.dart';
List<OrdinalData> ordinalDataList = [
  OrdinalData(
    domain: 'Speed',
    measure: 70,
    color: Colors.deepPurple,
  ),
  OrdinalData(
    domain: '-',
    measure: 30,
    color: Colors.deepPurple.shade50,
  ),
];
SizedBox(
height: 200,
width: 200,
child: Stack(
children: [
DChartPieO(
data: ordinalDataList,
configRenderPie: const ConfigRenderPie(
arcWidth: 10,
strokeWidthPx: 0,
arcLength: 7 / 5 * math.pi,
startAngle: 4 / 5 * math.pi,
),
),
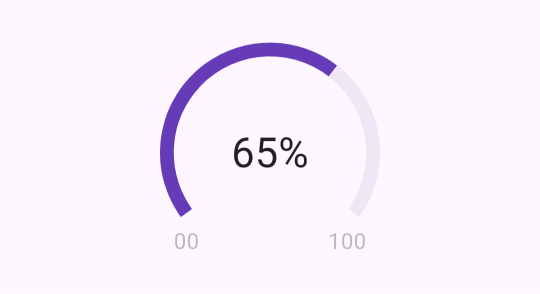
const Center(
child: Text(
'65%',
style: TextStyle(
fontSize: 30,
color: Colors.black87,
),
),
),
const Positioned(
bottom: 24,
left: 30,
right: 30,
child: Row(
mainAxisAlignment: MainAxisAlignment.spaceBetween,
children: [
Text(
'00',
style: TextStyle(
fontSize: 16,
color: Colors.black26,
),
),
Text(
'100',
style: TextStyle(
fontSize: 16,
color: Colors.black26,
),
),
],
),
),
],
),
),