Base DChart
Main attribute for DChart
groupList
| Type | default |
|---|---|
| List<G> | @required |
data per group
- List<NumericGroup>
- List<OrdinalGroup>
- List<TimeGroup>
renderType
| Type | default |
|---|---|
| RenderType Function(G group)? | null |
Render Type to draw chart
animate
| Type | default |
|---|---|
| bool | false |
animate chart when build
animationDuration
| Type | default |
|---|---|
| Duration | const Duration(milliseconds: 300) |
duration animate a chart when build
domainAxis
| Type | default |
|---|---|
| ChartAxis<T>? | DomainAxisN() or DomainAxisO() or DomainAxisT() |


measureAxis
| Type | default |
|---|---|
| ChartAxis<num>? | MeasureAxis() |

secondaryMeasureAxis
| Type | default |
|---|---|
| ChartAxis<num>? | MeasureAxis() |

useSecondaryMeasureAxis
| Type | default |
|---|---|
| bool Function(G group)? | false |
Setup which group will use secondary measure axis. Usually to compare one chart group with other chart group
useSecondaryMeasureAxis: (group) {
  return switch (group.id) {
    'id2' => true,
    _ => false,
  };
},
layoutMargin
| Type | default |
|---|---|
| LayoutMargin | null || 20px for each side |


allowSliding
| Type | default |
|---|---|
| bool | false |
Give user access to slide chart viewport.
Set initial viewport in domainAxis.
If set true, this will affect to 'measure viewport'.
Measure viewport will auto adjust depend on min/max from item chart value
To fix this, set viewport in measueAxis
defaultInteractions
| Type | default |
|---|---|
| bool | false |
Selected highlight effect
onUpdatedListener
| Type | default |
|---|---|
| void Function(D data)? | false |
listen which data is selected, set defaultInteractions to true
onChangedListener
| Type | default |
|---|---|
| void Function(D data)? | false |
listen which data is changed selected, set defaultInteractions to true
ltr
| Type | default |
|---|---|
| bool | true |
Left to Right
true:
measureAxis → chart → secondaryMeasureAxis
domain: smaller → biggerfalse:
secondaryMeasureAxis ← chart ← measureAxis
domain: bigger ← smaller


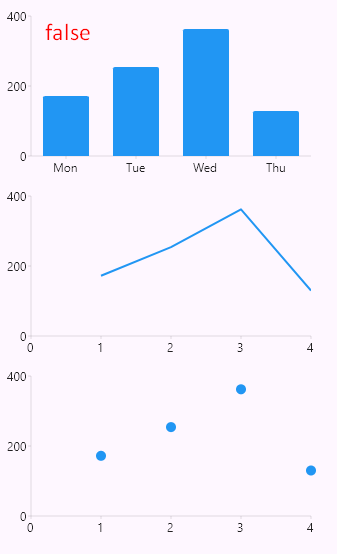
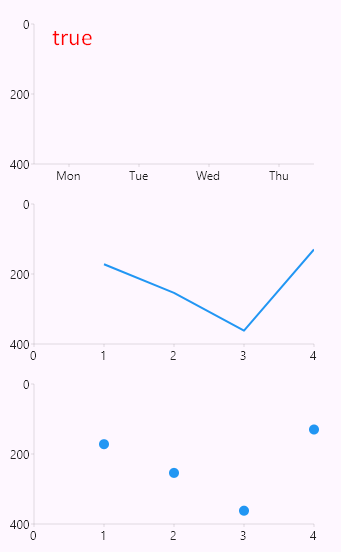
flipVerticalAxis
| Type | default |
|---|---|
| bool | false |
sort reversed measure axis