ConfigSeries
seriesColor
| Type | default |
|---|---|
| Color | null |
set single color for entire series
seriesColor: Colors.deepPurple,

customColor
| Type | default |
|---|---|
| Color Function(G group, D data, int? index)? | null |
unlike seriesColor, this property allows for dynamic color assignments based on data points
customColor: (group, data, index) {
  return switch (data.domain) {
    'Mon' => Colors.blue,
    'Tue' => Colors.green,
    _ => Colors.deepPurple,
  };
},

areaColor
| Type | default |
|---|---|
| Color Function(G group, D data, int? index)? | null |
returns the area color for a given data value. Specify for Line type. Can custom for each group.
includeArea must be set to true.
seriesColor: Colors.red,
stacked: true,
includeArea: true,
areaColor: (group, data, index) {
  return switch (group.id) {
    'id' => Colors.green.shade100,
    'id2' => Colors.blue.shade100,
    _ => Colors.purple.shade100,
  };
},

fillColor
| Type | default |
|---|---|
| Color? Function(G group, D data, int? index)? | null |
set fill chart where has fill box like bar
fillColor: (group, data, index) {
  return switch (data.domain) {
    'Tue' => Colors.green,
    _ => Colors.deepPurple,
  };
},

fillGradient
| Type | default |
|---|---|
| Gradient? Function(G group, D data, int? index)? | null |
If render type is bar, you must set fillPattern to FillPattern.gradient.
fillGradient: (group, data, index) {
  return const LinearGradient(
    begin: Alignment.topCenter,
    end: Alignment.bottomCenter,
    colors: [
      Colors.blue,
      Colors.purple,
    ],
  );
},

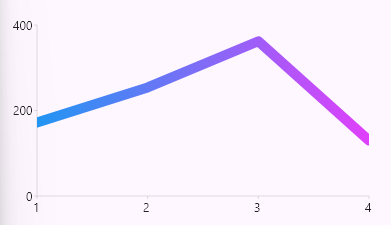
strokeGradient
| Type | default |
|---|---|
| Gradient? Function(G group, D data, int? index)? | null |
Set gradient color for stroke.
strokeGradient: (group, data, index) => const LinearGradient(
  colors: [Colors.blue, Colors.purpleAccent],
),
targetLineGradient
| Type | default |
|---|---|
| Gradient? Function(G group, D data, int? index)? | null |
just like strokeGradient, but better for clip bound size for gradient on each element
targetLineGradient: (group, data, index) {
  return const LinearGradient(
    colors: [Colors.yellow, Colors.cyan],
  );
},

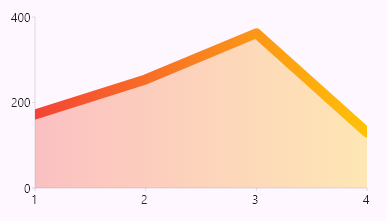
areaGradient
| Type | default |
|---|---|
| Gradient? Function(G group, D data, int? index)? | null |
Set gradient for area in line chart. includeArea property must be set to true. and you can adjust alpha channel or opacity from areaOpacity property.
areaGradient: (group, data, index) {
  return const LinearGradient(
    colors: [Colors.red, Colors.amber],
  );
},
fillPattern
| Type | default |
|---|---|
| FillPattern Function(G group, D data, int? index)? | null |
dashPattern
| Type | default |
|---|---|
| List<int>? Function(G group, D data, int? index)? | null |
specify for line pattern

labelAccessor
| Type | default |
|---|---|
| String Function(G group, D data, int? index)? | null |
set custom format value for label series, work for bar type
configSeriesBar: ConfigSeriesBarO(
  showBarLabel: true,
  labelAccessor: (group, data, index) {
    return '${data.measure} km';
  },
),

configSeriesPie: ConfigSeriesPieO(
  showLabel: true,
  arcLabelDecorator: const ArcLabelDecoratorO(
    labelPosition: ArcLabelPosition.outside,
  ),
  labelAccessor: (group, data, index) {
    return '${data.domain}\n${data.measure} km';
  },
),


strokeWidthPx
| Type | default |
|---|---|
| num? Function(G group, D data, int? index)? | null |
allows for dynamic stroke width assignments based on data points
strokeWidthPx: (group, data, index) {
  return switch (data.domain) {
    'Mon' => 8,
    _ => 2,
  };
},

radiusPx
| Type | default |
|---|---|
| num Function(G group, D data, int? index)? | null |
allows for dynamic radius series assignments based on data points
radiusPx: (group, data, index) {
  return switch (data.domain) {
    'Mon' => 12,
    'Tue' => 3,
    'Wed' => 8,
    _ => 5,
  };
},

measureOffset
| Type | default |
|---|---|
| num Function(G group, D data, int? index)? | null |
starting plot measure to draw chart
measure: (group, data, index) {
  return switch (data.domain) {
    'Tue' => data.measure - 70,
    _ => data.measure,
  };
},
measureOffset: (group, data, index) {
  return switch (data.domain) {
    'Tue' => 70,
    _ => 0,
  };
},

domain
| Type | default |
|---|---|
| T Function(G group, D data, int? index)? | null |
custom domain value
domainLowerBound
| Type | default |
|---|---|
| T? Function(G group, D data, int? index)? | null |
custom lower domain value
domainUpperBound
| Type | default |
|---|---|
| T? Function(G group, D data, int? index)? | null |
custom upper domain value
measure
| Type | default |
|---|---|
| num Function(G group, D data, int? index)? | null |
custom measure value
measureLowerBound
| Type | default |
|---|---|
| num? Function(G group, D data, int? index)? | null |
custom lower measure value
measureUpperBound
| Type | default |
|---|---|
| num? Function(G group, D data, int? index)? | null |
custom upper measure value