ConfigSeriesLine
Inherit
- seriesColor
- customColor
- fillColor as
pointColor - fillGradient as
pointGradient - strokeGradient
- areaGradient
- areaColor
- dashPattern
- strokeWidthPx
- radiusPx as
pointRadius - measureOffset
- domain
- domainLowerBound
- domainUpperBound
- measure
- measureLowerBound
- measureUpperBound
includeLine
| Type | default |
|---|---|
| bool | true |
Configures whether a line representing the data will be drawn.


stacked
| Type | default |
|---|---|
| bool | false |
adjust the offset of one chart above another chart.
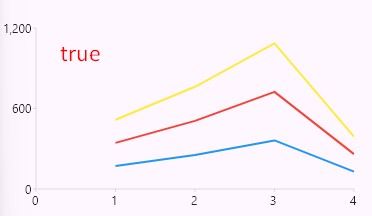

roundEndCaps
| Type | default |
|---|---|
| bool | false |
Whether lines should have round end caps, or square if false.


strokeWidthPxBase
| Type | default |
|---|---|
| double | 2 |
Stroke width of the line.
Prioritize: strokeWidthPx


dashPatternBase
| Type | default |
|---|---|
| List<int>? | null |
Dash pattern for the line.
Prioritize: dashPattern

includeArea
| Type | default |
|---|---|
| bool | false |
Configures whether an area skirt representing the data will be drawn.
An area skirt will be drawn from the line for each series, down to the domain axis. It will be layered underneath the primary line on the chart.
The area skirt color will be a semi-transparent version of the series color, using [areaOpacity] as the opacity.
When stacking is enabled, the bottom of each area skirt will instead be the previous line in the stack. The bottom area will be drawn down to the domain axis.

areaOpacity
| Type | default |
|---|---|
| double | 5 |
Configures the opacity of the area skirt on the chart.
value: 0 - 1
If areaColor already set, opacity must be set from areaColor.


includePoints
| Type | default |
|---|---|
| bool | false |
Configures whether points representing the data will be drawn.

pointSymbol
| Type | default |
|---|---|
| SymbolRender | const SymbolRenderCircle() |
symbol for point:
Circle, Line, Rect, RoundedRect, Triangle
pointRadiusBase
| Type | default |
|---|---|
| double | 5 |
Radius of points on the line, if [includePoints] is enabled.
Prioritize: pointRadius

includePointLabel
| Type | default |
|---|---|
| bool | false |
show label on plot point

pointLabelDecorator
| Type | default |
|---|---|
| PointLabelDecorator<D,T> | const PointLabelDecorator<T>() |
to decor label on plot point