b5

import 'package:d_chart/d_chart.dart';
import 'package:flutter/material.dart';
import 'package:intl/intl.dart';
TimeData maxTimeData = TimeData(domain: DateTime(2024, 1), measure: 10);

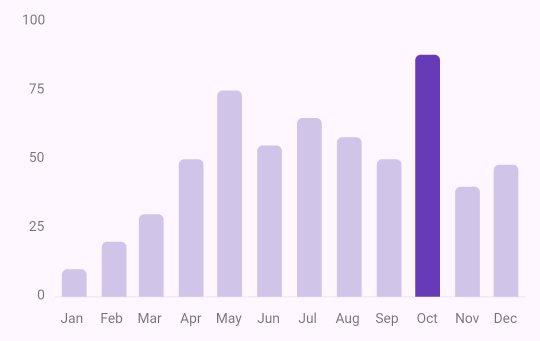
List<TimeData> series1 = [
  TimeData(domain: DateTime(2024, 1), measure: 10),
  TimeData(domain: DateTime(2024, 2), measure: 20),
  TimeData(domain: DateTime(2024, 3), measure: 30),
  TimeData(domain: DateTime(2024, 4), measure: 50),
  TimeData(domain: DateTime(2024, 5), measure: 75),
  TimeData(domain: DateTime(2024, 6), measure: 55),
  TimeData(domain: DateTime(2024, 7), measure: 65),
  TimeData(domain: DateTime(2024, 8), measure: 58),
  TimeData(domain: DateTime(2024, 9), measure: 50),
  TimeData(domain: DateTime(2024, 10), measure: 88),
  TimeData(domain: DateTime(2024, 11), measure: 40),
  TimeData(domain: DateTime(2024, 12), measure: 48),
];
void findMaxDomain() {
  for (final data in series1) {
    if (data.measure > maxTimeData.measure) {
      maxTimeData = data;
    }
  }
  setState(() {});
}
void initState() {
findMaxDomain();
super.initState();
}
AspectRatio(
  aspectRatio: 16 / 9,
  child: DChartBarT(
    layoutMargin: LayoutMargin(40, 10, 10, 10),
    configRenderBar: ConfigRenderBar(
      radius: 4,
    ),
    fillColor: (group, timeData, index) {
      return timeData.domain == maxTimeData.domain
          ? Colors.deepPurple
          : null;
    },
    domainAxis: DomainAxis(
      showLine: true,
      lineStyle: LineStyle(color: Colors.grey.shade200),
      tickLength: 0,
      gapAxisToLabel: 12,
      labelStyle: const LabelStyle(
        fontSize: 10,
        color: Colors.black54,
      ),
      tickLabelFormatterT: (domain) {
        return DateFormat.MMM().format(domain);
      },
    ),
    measureAxis: const MeasureAxis(
      gapAxisToLabel: 8,
      numericTickProvider: NumericTickProvider(
        desiredMinTickCount: 5,
        desiredMaxTickCount: 10,
      ),
      tickLength: 0,
      labelStyle: LabelStyle(
        fontSize: 10,
        color: Colors.black54,
      ),
    ),
    groupList: [
      TimeGroup(
        id: '1',
        data: series1,
        color: Colors.deepPurple.shade100,
      ),
    ],
  ),
),