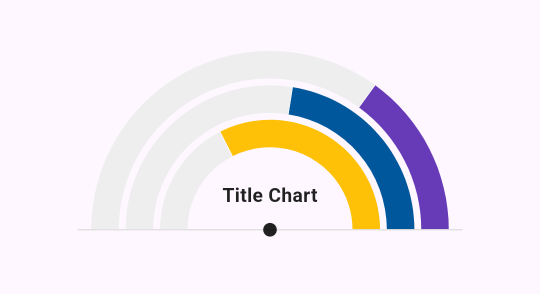
p9

import 'dart:math' as math;
import 'package:d_chart/d_chart.dart';
import 'package:flutter/material.dart';
List<OrdinalData> data1 = [
  OrdinalData(
    domain: 'Completed',
    measure: 65,
    color: Colors.amber,
  ),
  OrdinalData(
    domain: 'Uncompleted',
    measure: 35,
    color: Colors.grey.shade200,
  ),
];
List<OrdinalData> data2 = [
  OrdinalData(
    domain: 'Completed',
    measure: 45,
    color: Colors.lightBlue.shade900,
  ),
  OrdinalData(
    domain: 'Uncompleted',
    measure: 55,
    color: Colors.grey.shade200,
  ),
];
List<OrdinalData> data3 = [
  OrdinalData(
    domain: 'Completed',
    measure: 30,
    color: Colors.deepPurple,
  ),
  OrdinalData(
    domain: 'Uncompleted',
    measure: 70,
    color: Colors.grey.shade200,
  ),
];
SizedBox(
  height: 300,
  width: 300,
  child: Stack(
    children: [
      Padding(
        padding: const EdgeInsets.all(50),
        child: Transform.flip(
          flipX: true,
          child: DChartPieO(
            data: data1,
            configRenderPie: const ConfigRenderPie(
              strokeWidthPx: 0,
              arcWidth: 20,
              arcLength: math.pi,
              startAngle: -math.pi,
            ),
          ),
        ),
      ),
      Padding(
        padding: const EdgeInsets.all(25),
        child: Transform.flip(
          flipX: true,
          child: DChartPieO(
            data: data2,
            configRenderPie: const ConfigRenderPie(
              strokeWidthPx: 0,
              arcWidth: 20,
              arcLength: math.pi,
              startAngle: -math.pi,
            ),
          ),
        ),
      ),
      Transform.flip(
        flipX: true,
        child: DChartPieO(
          data: data3,
          configRenderPie: const ConfigRenderPie(
            strokeWidthPx: 0,
            arcWidth: 20,
            arcLength: math.pi,
            startAngle: -math.pi,
          ),
        ),
      ),
      Center(
        child: Divider(
          indent: 10,
          endIndent: 10,
          color: Colors.grey.shade300,
        ),
      ),
      const Center(
        child: Icon(Icons.circle, size: 12, color: Colors.black87),
      ),
      const Align(
        alignment: Alignment(0, -0.18),
        child: Text(
          'Title Chart',
          style: TextStyle(
            fontWeight: FontWeight.bold,
            fontSize: 14,
            color: Colors.black87,
          ),
        ),
      ),
    ],
  ),
),