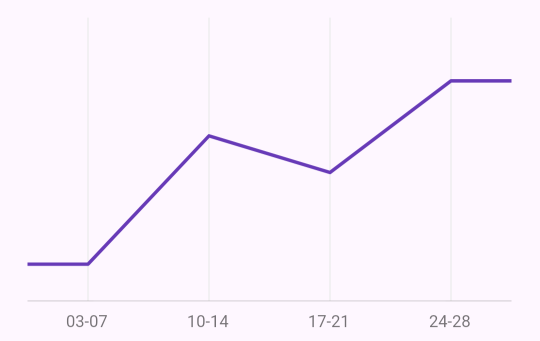
AspectRatio(
  aspectRatio: 16 / 9,
  child: DChartLineN(
    configRenderLine: ConfigRenderLine(
      strokeWidthPx: 2.5,
    ),
    layoutMargin: LayoutMargin(20, 10, 20, 10),
    domainAxis: DomainAxis(
      numericViewport: const NumericViewport(0.5, 4.5),
      useGridLine: true,
      gridLineStyle: LineStyle(
        color: Colors.grey.shade200,
      ),
      tickLength: -6,
      tickLineStyle: const LineStyle(
        color: Colors.black45,
        thickness: 2,
      ),
      gapAxisToLabel: 10,
      tickLabelFormatterN: (domain) {
        final data = series1.where((e) => e.domain == domain).firstOrNull;
        return data?.other ?? '$domain';
      },
      labelStyle: const LabelStyle(
        color: Colors.black54,
      ),
    ),
    measureAxis: const MeasureAxis(
      numericViewport: NumericViewport(0, 150),
      noRenderSpec: true,
    ),
    groupList: [
      NumericGroup(
        id: '1',
        data: series1,
        color: Colors.deepPurple,
      ),
    ],
  ),
),
